
Think of a share of voice calculator as a way to measure your brand's visibility against competitors. At its simplest, it's just your brand's performance on a specific metric divided by the total market performance for that same metric. It's about quantifying your slice of the conversation pie, whether that conversation is happening on Google, social media, or even in AI chatbots.
What Is Share of Voice and Why It Still Matters
Before you can start calculating anything, you have to get a real feel for what Share of Voice (SOV) represents. At its heart, SOV measures your brand’s presence in the market compared to everyone else. This isn’t just some vanity metric to show off in a meeting; it's a powerful leading indicator of future market share and, ultimately, revenue.
Here’s the key insight: when your SOV is higher than your actual market share, it’s a strong signal that your brand is on a growth path. On the flip side, a dropping SOV can be the first red flag that competitors are eating into your territory, giving you a chance to react before it hits your sales numbers.
From Traditional Ads to Digital Dominance
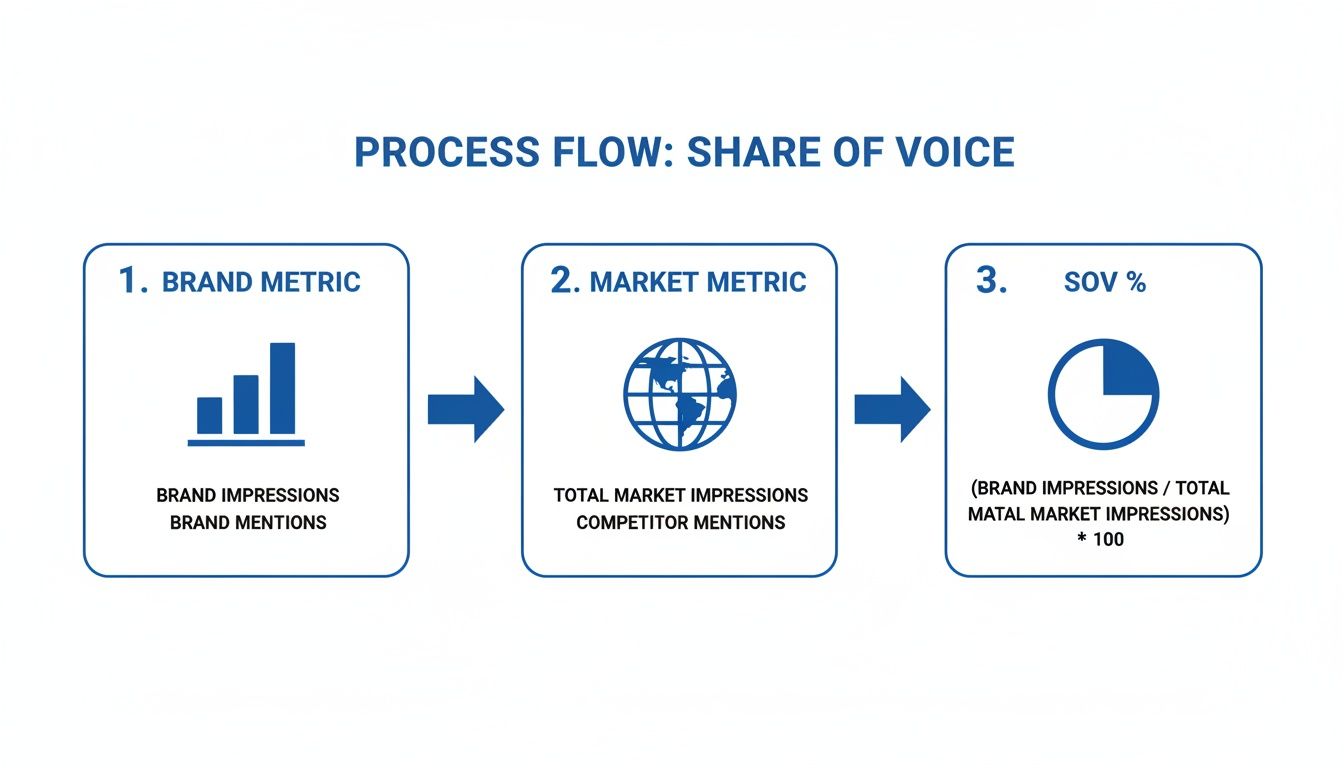
The idea of SOV has been around for ages. It got its start in the old-school world of media buying and PR, where agencies used it to track visibility in print, radio, and TV ads. The formula has stayed pretty much the same: SOV = (your brand’s metric ÷ total market metric) × 100. Back in the 90s, TV planners were obsessed with using metrics like gross rating points to dominate key time slots.
But the game has changed entirely. As global digital ad spend skyrocketed from about 30% of total budgets in 2014 to over 60% by 2023, the places we measure SOV shifted online. You can read more about this evolution and how the metrics adapted over on NewzGroup's blog.
This digital takeover means any modern share of voice calculator needs to pull from a much wider and more complex set of data points. It's not just about who spends the most on ads anymore. Today's SOV is a blend of multiple digital battlegrounds:
- Organic Search Visibility: How often do you show up for your target keywords versus the competition?
- Social Media Mentions: Who is winning the conversation on platforms like X, Instagram, and LinkedIn?
- Paid Media Impressions: What's your share of the eyeballs in PPC and paid social campaigns?
- AI Chat Recommendations: When people ask AI assistants like ChatGPT for advice, is your brand the one they suggest?
A strong Share of Voice acts like an early warning system. It helps you anticipate market shifts and spot competitive threats before they show up in your sales reports, giving you a vital strategic advantage.
When you start to see it this way, SOV stops being an abstract marketing buzzword and becomes a tangible Key Performance Indicator (KPI). It gives you a clear, quantifiable measure of your brand's real-world influence and helps you set goals that actually move the needle. By tracking it consistently, you’re not just looking in the rearview mirror; you're actively shaping where your brand is headed.
How to Build Your Own Share of Voice Calculator
Alright, let's move from theory to action. This is where you get a real edge. Building a Share of Voice calculator doesn't mean you need some fancy, expensive software. Honestly, a simple spreadsheet is all it takes to turn raw numbers into smart decisions. The process itself is incredibly valuable—it forces you to get crystal clear on who you're really competing against and which channels actually matter.
The first hurdle is always the same: defining your competitive landscape. Don’t just list the big household names. Your true competitors are the ones fighting for the exact same customer attention, on the same platforms, right now. A local coffee shop's biggest rival is probably the café down the street, not Starbucks corporate.
Once you have your list, pick your battles. Trying to monitor every single platform is a fast track to burnout. Instead, narrow it down to the top 2-3 channels where your audience actually hangs out.
- Organic Search: This is all about your visibility on Google. The key metric here is impressions—how many times your site shows up in search results for your target keywords.
- Social Media: This tracks your pulse on the platforms where customers are talking. You'll be looking at things like brand mentions or the usage of specific hashtags.
- Paid Media: This is about the reach of your ads. Just like with organic, you'll be focused on impressions from your PPC or paid social campaigns.
The whole process boils down to three parts: get your brand's data, get the same data for the total market (that’s you plus your competitors), and then run the calculation.
Data Sources for Your Share of Voice Calculator
To fill your calculator, you need to pull the right numbers from the right places. Having a clear map of your data sources from the start makes the whole process smoother and more reliable.
Here’s a breakdown of the common channels, the metrics to grab, and some tools you can use to find them.
| Channel | Metric to Track | Example Tools |
|---|---|---|
| Organic Search | Keyword Impressions | Google Search Console, Semrush, Ahrefs |
| Social Media | Brand Mentions, Hashtag Usage | Brand24, Sprout Social, Native Platform Search |
| Paid Media (PPC) | Ad Impressions | Google Ads, Microsoft Advertising |
| Paid Social | Ad Impressions | Meta Ads Manager, LinkedIn Campaign Manager |
| LLM/AI Assistants | Brand Recommendations, Mentions | TrackMyBiz |
This table isn't exhaustive, but it gives you a solid foundation. The key is to pick your tools and stick with them to ensure your data is consistent month over month.
Structuring Your Spreadsheet Calculator
Time to get practical. Open up Google Sheets or Excel and let's build this thing. The goal is to make it easy to plug in numbers and see the results without a lot of fuss. I find it works best to create separate tabs for each channel you’re tracking, like "Organic Search," "Social," and so on.
Inside each tab, you'll need a few columns: Competitor Name, the specific Metric (like "Impressions"), and the Data Source to remember where you got it.
Here’s a quick look at what the "Organic Search" tab might look like:
| Competitor Name | Keyword Group | Monthly Impressions | Data Source |
|---|---|---|---|
| Your Brand | "luxury coffee beans" | 15,000 | Google Search Console |
| Competitor A | "luxury coffee beans" | 25,000 | Semrush |
| Competitor B | "luxury coffee beans" | 20,000 | Ahrefs |
| Competitor C | "luxury coffee beans" | 10,000 | Semrush |
| Total Market | "luxury coffee beans" | 70,000 | SUM(C2:C5) |
Gathering the Right Data
Now comes the legwork. For your own brand's organic search data, the numbers you get from your Search Console metrics are your ground truth. For competitor data, you’ll have to lean on third-party SEO tools like Semrush or Ahrefs.
For social media, you can often just use the platform's search bar to manually count mentions or hashtag uses over a set period. If you have a social media management tool, it can usually pull these reports for you much faster. Paid media impressions are the easiest—they're right there in your Google Ads or social ad dashboards.
Pro Tip: Consistency is everything. Measure over the same time frame every single time (I recommend monthly) and use the exact same tools. If you switch data sources halfway through, you'll corrupt your trend data and make it impossible to see if you're actually making progress.
Calculating Your Share of Voice
This is the easy part. In a final summary tab in your spreadsheet, you'll pull all your numbers together. The formula is the same for every channel:
=(Your Brand's Metric / Total Market Metric)
Just format that cell as a percentage. Using our coffee example from earlier, your Organic Search SOV would be =15000/70000, which gives you 21.4%. Simple as that.
Do this for every channel you're tracking. Before you know it, you’ll have a dashboard that gives you a powerful, at-a-glance view of your market standing. This simple spreadsheet turns abstract data into a real performance indicator you can actually use.
Alright, you've plugged in the numbers and your share of voice calculator has spit out a percentage. Now what?
A raw number doesn't tell you much on its own. The real magic happens when you understand what that percentage actually means for your business and in your specific market.

First things first: resist the urge to compare your SOV to some generic industry benchmark. Is 10% SOV good? It completely depends. In a small B2B niche with just a few key players, a 15% SOV might mean you're the top dog. But in a ridiculously crowded space like consumer electronics, even a 5% SOV could be a massive win.
Think of your first calculation as your baseline. It's the starting line, not the finish. The goal from here is to track this number over time to see what's trending, spot competitive threats before they become problems, and prove your marketing campaigns are actually working.
The Power of Excess Share of Voice
One of the most valuable concepts here is the relationship between Share of Voice (SOV) and Share of Market (SOM). They sound similar, but they measure two very different things. SOV is your marketing visibility, while SOM is your actual slice of the sales pie.
This is where the idea of Excess Share of Voice (eSOV) becomes so powerful. It's a simple calculation:
eSOV = SOV (%) – SOM (%)
Let's say you have a 12% SOV but only an 8% market share. Your eSOV is +4%. That positive gap is a fantastic predictor of future growth. It means your brand's visibility is punching above its weight, and your market share is likely to follow.
On the flip side, a negative eSOV can be an early warning that your market share is about to shrink. It’s a signal that you're not visible enough to sustain your current sales. You can get more great insights on this relationship from the team at Brand24.
Setting Realistic and Actionable Goals
Now that you have your baseline SOV and understand eSOV, you can start setting goals that actually matter. Instead of just chasing a bigger number for the sake of it, tie your SOV targets to real business outcomes.
Here are a few ways to think about it:
- Growing Market Share: If the big goal is to grow your market share by 2% this year, your SOV goal might be to achieve and hold an eSOV of at least +2% for two straight quarters.
- Defending Your Turf: Did a new competitor just crash the party? A smart defensive goal would be to maintain your current SOV in a crucial channel, like organic search, to keep them from stealing your thunder.
- Owning a New Channel: If you're breaking into a new area like AI chat recommendations, an initial goal could be to capture a 5% SOV within six months. This is especially vital now, as tracking your visibility on AI assistants is no longer optional. For more on this, check out our guide on AI brand tracking for SaaS companies.
Benchmarking Against Your True Competitors
Your SOV data becomes infinitely more valuable when you see it next to your direct competitors. A good calculator won't just show you your slice of the pie; it'll show you how big everyone else's slice is, too.
Dig into this competitive data to find opportunities and threats you'd otherwise miss.
| Scenario | What It Might Mean | Your Next Move |
|---|---|---|
| High Overall SOV, Low Social SOV | A competitor is owning the conversation on a social platform where you’re barely present. | Launch a targeted campaign on that platform to get in front of their audience. |
| Competitor C Has Low Visibility | A smaller player is flying under the radar right now but could become a problem later. | Keep a close eye on their activity and be ready to counter their next marketing push. |
| You Lead in PPC, Lag in Organic | Your ad spend is working, but you don't have a strong, long-term organic foundation. | Funnel a portion of that ad budget into a solid SEO and content marketing strategy. |
When you break down the data this way, your share of voice calculator stops being a simple measurement tool and becomes a strategic compass. It shows you where to put your money, how to prioritize your campaigns, and helps you make moves before the market forces your hand.
The New Frontier: Measuring SOV in AI Chat
Your beautifully crafted spreadsheet is probably great for tracking search and social media visibility. But a massive blind spot has opened up for most businesses, and it's one that traditional SOV calculators are completely unequipped to handle.
This new frontier is AI-driven conversation.
As more and more people bypass search engines and just ask AI assistants like ChatGPT and Gemini for direct recommendations, a new battle for visibility is heating up. This is where AI Share of Voice comes in. It’s a straightforward measure of how often your brand gets mentioned or recommended by large language models (LLMs) compared to your competitors.
Ignoring this channel is no longer an option. Someone asking, "What's the best local coffee shop?" or "Which software should I use for project management?" is a customer ready to buy. The brands that get named in that single, authoritative-sounding AI response are the ones who get the click, the call, or the sale.
Why Traditional SOV Calculators Just Don't Work Here
The old methods for tracking search impressions or social mentions are useless for AI chat. You can't just scrape an AI's output the way you would a webpage. The responses are dynamic, personalized, and generated in real-time, making any kind of manual tracking impossible at a meaningful scale.
This creates a critical visibility gap where you could be losing customers without even knowing it.
Over the last few years, a new breed of AI-era share of voice calculators has emerged. They measure how often models like ChatGPT, Perplexity, and Gemini mention a brand versus its rivals. For instance, while traditional tools might tell you that you own 25% of the social media SOV, an AI-focused analysis could reveal you only appear in 5–10% of AI assistant answers for crucial queries like “best plumber near me” or “top shoe store in Chicago.”
That's a huge disconnect with direct revenue implications. This isn't some future problem; it's happening right now. For local businesses, service providers, and e-commerce stores, a low AI SOV can quietly bleed revenue. If your competitor gets recommended and you don't, you’ve lost a lead at the final, most important step.
This is what a typical Brand Rank report looks like. It visualizes a brand's AI Share of Voice against its key competitors, making it easy to see who's winning.
This kind of visual data immediately tells you which brands are dominating AI recommendations and which ones are falling behind. It’s a clear snapshot of the competitive landscape in this new, vital channel.
The Urgent Need to Monitor AI Recommendations
The challenge with AI mentions goes beyond simple visibility. LLMs can also generate incorrect information—what are known as "hallucinations." They might list the wrong business hours, invent negative reviews, or even falsely claim your business is permanently closed.
These inaccuracies can cause immediate and direct harm to your reputation and bottom line.
Without a system to monitor what these influential AI models are saying, you're flying blind. You have no way of knowing if you're being recommended, ignored, or actively misrepresented to potential customers.
This is why specialized tools have become essential. For agencies and consultants, the ability to track this new metric is a massive value-add for clients. Knowing how to perform LLM visibility tracking for agencies is quickly becoming a required skill. It's about more than just marketing; it's about brand protection and reputation management in an entirely new context.
- Protect Your Revenue: Ensure potential customers are getting accurate, positive information about your business right when they are ready to buy.
- Identify Competitive Threats: See which competitors are consistently winning AI recommendations and figure out why.
- Find New Opportunities: Discover the prompts and questions that lead users to your industry and make sure you're part of that conversation.
Integrating AI SOV into your overall measurement strategy is the next logical step. It closes the loop, giving you a much more complete picture of your brand's true visibility. It moves you from a reactive position to a proactive one, allowing you to influence and correct the AI conversation before it costs you another customer.
The brands that master this new frontier will be the ones that win the next decade of digital marketing.
Automating Your SOV Measurement for Better Insights
A manual share of voice calculator built in a spreadsheet is a fantastic starting point. It forces you to get your hands dirty, really understand your market, and establish a clear baseline. But you'll quickly hit a wall.
The manual grind is time-consuming, prone to copy-paste errors, and nearly impossible to scale effectively as your brand or market grows.
This is where automation stops being a luxury and becomes a necessity for gaining a real competitive edge. To get a comprehensive, real-time view of your visibility, you have to move beyond static spreadsheets and adopt a dedicated platform.

Beyond the Spreadsheet: The Case for Automation
Let’s be honest: manually collecting data across search, social media, and PPC is a tedious chore. While you can learn how to scrape Google Search results to pull invaluable competitive data, that information is stale almost as soon as you’ve compiled it.
An automated platform like TrackMyBiz completely eliminates this manual work. It pulls data continuously, giving you a dynamic view of your market presence without you lifting a finger. This frees you up to focus on strategy, not data entry.
The real value of automation isn't just saving time; it's about unlocking deeper, more timely insights. You can spot a competitor's new campaign the day it launches, not a month later when you finally get around to updating your spreadsheet.
Let's break down the difference between the two approaches. The table below compares the old-school manual method with a modern automated platform.
Manual vs. Automated SOV Tracking
| Feature | Manual Spreadsheet Calculator | Automated Platform (TrackMyBiz) |
|---|---|---|
| Data Collection | Time-consuming manual entry from various sources. | Real-time, continuous data aggregation. |
| Scalability | Difficult to scale; more competitors or channels increase complexity exponentially. | Easily scales to track multiple competitors across various channels. |
| AI SOV Tracking | Impossible to track AI recommendations accurately. | Core feature; provides a dynamic AI Share of Voice score. |
| Error Potential | High risk of data entry errors and inconsistencies. | Minimal error risk with standardized data collection. |
| Insights | Provides a static, point-in-time snapshot. | Offers trend analysis, real-time alerts, and deeper competitive intelligence. |
As you can see, while a manual calculator is a good first step, an automated platform is what gives you the power to actually act on the data you're collecting.
Automating the New Frontier: AI Share of Voice
The most compelling reason to automate is to track the new AI-driven landscape. Manually checking what ChatGPT, Gemini, or other models say about you just isn't feasible. Responses are dynamic and can change daily, making a platform like TrackMyBiz essential.
TrackMyBiz is built from the ground up to automate the monitoring of AI assistant recommendations. It gives you a live AI Share of Voice score by constantly querying these models with prompts that matter to your business.
This isn't just about seeing a percentage. The platform's dashboard provides a multi-faceted view of your AI presence. You can see:
- Who is being recommended: The dashboard clearly shows which competitors are being suggested instead of you for critical buying-intent questions.
- Sentiment analysis: It goes beyond just mentions to analyze whether the AI's description of your brand is positive, neutral, or negative.
- Factual accuracy checks: A crucial feature is the ability to spot dangerous AI "hallucinations." TrackMyBiz can alert you if an LLM is reporting incorrect business hours, listing the wrong prices, or even falsely claiming you are permanently closed.
Turning Automated Insights into Action
With this level of automated intelligence, you can take immediate, strategic action. Imagine your dashboard alerts you that a competitor has suddenly started dominating AI recommendations for your top service.
This insight allows you to investigate why. Are they mentioned in the training data more frequently? Have they optimized their online content in a way that LLMs favor? Armed with this knowledge, you can adjust your own strategy to reclaim that visibility.
By continuously tracking your competitors, you gain a much clearer picture of their playbook. You can dive even deeper by exploring various competitor AI analysis tools to get a complete lay of the land.
Ultimately, automating your SOV measurement transforms it from a reactive reporting task into a proactive strategic weapon. It provides the speed and depth needed to not just keep up with the market, but to anticipate its next move and secure your brand's position.
Common Questions About Share of Voice
Even with a solid calculator in hand, a few practical questions always pop up when you start putting Share of Voice into practice. Let’s tackle some of the most common ones I hear, so you can move from just calculating the metric to actually using it to make smarter decisions.
The goal isn't just to land on a number. It's to understand the story behind it and know exactly what to do next.
How Often Should I Calculate Share of Voice?
The honest answer? It depends entirely on the speed of your market. If you're in a fast-paced industry like e-commerce or consumer tech where trends and campaigns shift weekly, a monthly calculation is pretty much non-negotiable. This rhythm lets you keep a pulse on competitor launches, seasonal spikes, and quick changes in what customers are talking about.
On the other hand, for businesses with longer sales cycles—think B2B SaaS or high-end consulting—a quarterly check-in usually hits the sweet spot. It's a long enough timeframe to see meaningful strategic shifts without getting lost in the noise of minor, short-term blips.
The most important thing isn’t the exact interval you land on; it’s consistency. Pick a schedule your team can realistically stick to. Consistent measurement is the only way you’ll ever build a reliable benchmark and spot the patterns that matter over time.
What Is the Difference Between SOV and Share of Market?
This is a big one, and the confusion is understandable. While the two metrics are definitely related, they measure fundamentally different things and tell you different parts of your business's story.
- Share of Voice (SOV): Think of this as a leading indicator. It’s all about your marketing visibility and brand presence. It measures how much of the conversation—across ads, social media, search, and now AI chats—you own compared to your competitors.
- Share of Market (SOM): This is a lagging indicator. It measures your actual sales results. Simply put, it's your company's revenue as a percentage of the total market sales.
Here’s a simple way to frame it: a consistently high Share of Voice is often a strong predictor of a future increase in your Share of Market. One measures your potential, and the other measures your results. You really need both for a complete picture of your brand's health and trajectory.
Can I Calculate SOV with a Small Budget?
Absolutely. You don't need a suite of expensive, enterprise-level tools to get started. The manual spreadsheet calculator we broke down earlier is the perfect, budget-friendly way to begin.
When it comes to gathering the data, you can get surprisingly far with free resources:
- Google Alerts: Set these up to track mentions of your brand and your top two or three competitors across the web. It's simple but effective.
- Native Social Search: Use the built-in search functions on platforms like X (formerly Twitter) and LinkedIn. You can manually count brand mentions or hashtag usage over a specific period.
- Free SEO Tools: The free versions of popular SEO tools can give you a basic sense of keyword rankings and search visibility without costing a dime.
The initial goal isn't perfection; it's to start tracking the metric consistently. Get the process down and build the habit. You can always invest in more powerful automation tools as you grow and your needs get more complex.
A manual share of voice calculator is a great first step, but to truly protect your brand and find new customers, you need to know what AI assistants are saying about you. TrackMyBiz automates this process, giving you a real-time view of your AI Share of Voice, flagging dangerous misinformation, and showing you exactly where you stand against the competition. Start a free scan today at https://trackmybusiness.ai.