
Share of Voice (SOV) is all about figuring out how much of the conversation your brand actually owns compared to your competitors. At its core, the share of voice calculation is straightforward:
(Your Brand's Metric / Total Market Metric) x 100
This simple formula is the key to unlocking a powerful view of your brand's health and competitive standing across every channel that matters.
Why Your Share of Voice Calculation Matters
Thinking of Share of Voice as just another advertising metric is an outdated view. Today, a solid SOV calculation is a direct measure of your brand’s real-world influence. It tells you how much of the conversation you truly own, whether that’s in Google search results, on social media, or even in the answers from an AI assistant.
Of course, it wasn't always this complex. Back in the 1960s advertising world, SOV was a simpler concept—it was all about your ad spend versus the total ad spend in your category. The big discovery then was that a higher SOV often led to a much bigger market share, a truth that still holds today.
Moving Beyond Simple Metrics
The way customers find and interact with brands has exploded in complexity, and so has the way we need to calculate SOV. It's no longer just about who has the deepest pockets for ads. Now, it’s a mix of metrics that reflect genuine visibility and customer engagement.
To really get a handle on it, you have to look at the whole picture:
- Organic Search Visibility: How often do you show up for the keywords that drive your business? This isn't just about ranking; it's about how visible you are where it counts.
- Social Media Mentions: Who’s talking about you, and how does that volume compare to your competitors?
- Paid Media Impressions: In the ad world, what’s your impression share in PPC and paid social campaigns?
- AI and LLM Recommendations: This is the new frontier. How often do AI assistants like ChatGPT bring up your brand when users ask relevant questions? You can dive deeper into this critical area in our guide to AI brand tracking for SaaS companies.
A strong Share of Voice is a leading indicator of future market share growth. If you are more visible than your competitors today, you are more likely to attract their customers tomorrow.
Ultimately, getting a grip on your share of voice calculation gives you a complete, honest look at where you stand. It pulls you out of the weeds of siloed channel metrics and gives you a unified understanding of your brand's power in the market.
Share of Voice Evolution Across Channels
The concept of "voice" has transformed dramatically from the days of print and television. What was once measured in ad dollars is now measured in clicks, mentions, and impressions across a dozen different platforms. This table shows just how much the core metric has evolved.
| Channel | Traditional Metric (Pre-Digital) | Modern Digital Metric |
|---|---|---|
| Search | N/A | Organic Keyword Rankings & Impression Share |
| Paid Media | Ad Spend (Gross Rating Points) | Impression Share & Click Share |
| Social Media | N/A | Brand Mentions & Hashtag Volume |
| Public Relations | Column Inches in Print | News Mentions & Backlinks |
| AI Assistants | N/A | Recommendations & Brand Mentions in Responses |
As you can see, the principle remains the same—measuring your presence against the total available presence—but the metrics themselves have become far more specific and digital-native. Understanding this shift is the first step to measuring what truly matters today.
How To Calculate SOV For Organic And Paid Search
Alright, let’s get down to the nuts and bolts. We're going to calculate Share of Voice where it arguably matters most these days: on the search engine results page. Here are the exact formulas and some real-world examples for both the organic and paid sides of the equation.
To truly understand your search visibility, you have to master the right ways to calculate share of voice. While both organic and paid fall under the "search" umbrella, the way you measure them is completely different, reflecting just how unique each channel is.
Weighted Organic Search SOV
Gone are the days of just tracking your rank for a handful of keywords. That's old-school thinking. A modern share of voice calculation for SEO has to reflect the reality that a #1 ranking is worth exponentially more than a #10 ranking. This is where weighting by click-through rate (CTR) becomes essential.
The formula is pretty straightforward:
(Your Total Weighted Visibility / Total Market Weighted Visibility) x 100
To figure out your "weighted visibility" for a single keyword, you just multiply the keyword's monthly search volume by the average CTR for your ranking position.
Here’s a quick example:
- Keyword: "Project management software" (10,000 searches/month)
- Your Rank: #3 (Average CTR: 11%)
- Your Visibility Score: 10,000 x 0.11 = 1,100
- Competitor A's Rank: #1 (Average CTR: 28%)
- Competitor A's Visibility Score: 10,000 x 0.28 = 2,800
You'd run this calculation for every important keyword and for every competitor you're tracking. Add them all up, and you'll get the total market visibility, which lets you find your percentage share. For a deeper dive into competitor strategies, you can explore various competitor AI analysis tools to uncover more insights.
Paid Search SOV Using Impression Share
For paid search, things get a whole lot simpler. Platforms like Google Ads give you the exact metric you need right out of the box: Impression Share. It tells you what percentage of the time your ads were actually shown, compared to the total number of times they could have been shown.
Impression Share is your share of voice for paid search. If your impression share for a given keyword is 40%, your paid SOV for that keyword is 40%. It’s that simple.
You can find this data right in your Google Ads account. Just make sure you've enabled the "Competitive metrics" columns in your reporting view.
This entire concept of SOV has changed so much over the years, moving from simple ad spend comparisons to complex digital metrics, and now, into the new world of AI-powered search.
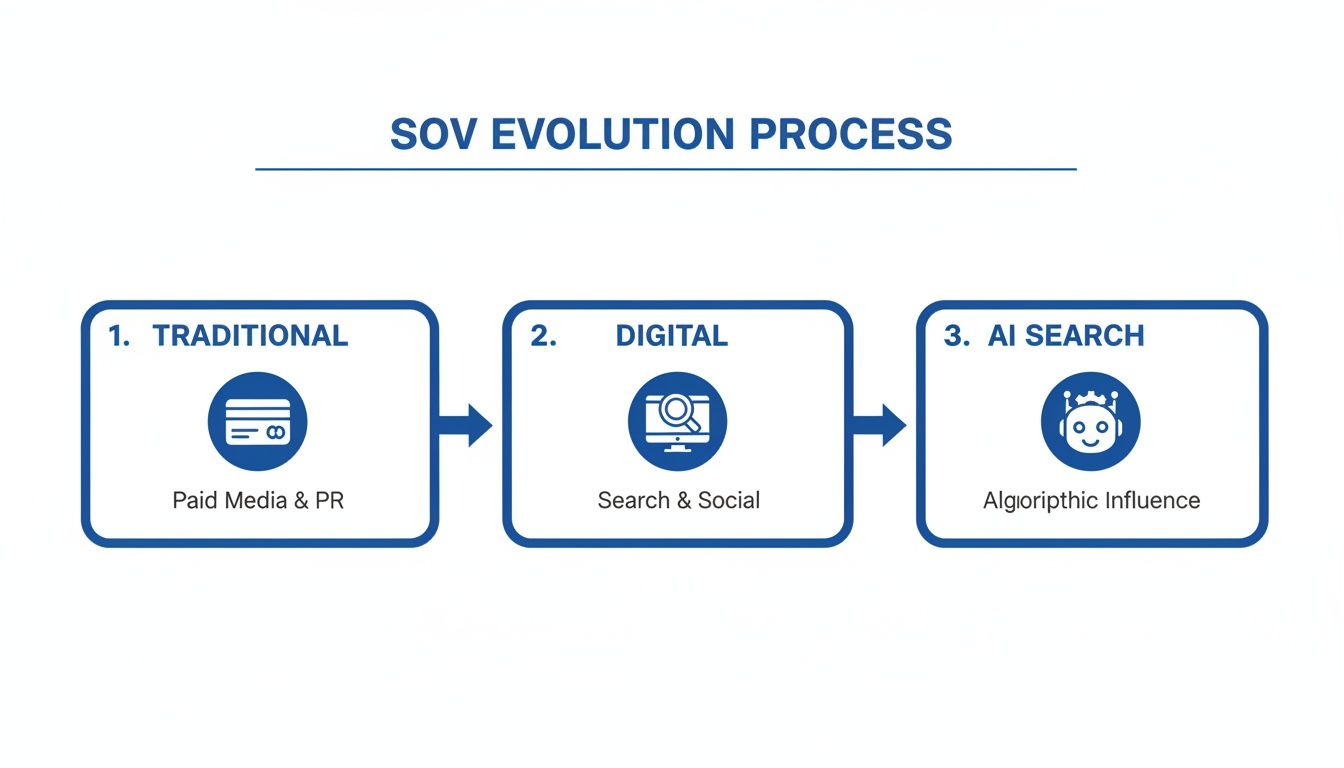
As the graphic shows, the game keeps evolving. Brands now need to think about their visibility in places like AI chatbots to get a complete picture of their market presence. When you combine your weighted organic SOV with your paid impression share, you get a powerful, holistic view of just how much of the search landscape you truly own.
Measuring Your Brand's Voice on Social Media

While search visibility is a cornerstone of digital marketing, social media is where the conversation about your brand happens in real-time. It’s a loud, fast-moving space, but getting a handle on your Share of Voice here is absolutely essential for understanding how the public sees you and where you stand against the competition.
The basic share of voice calculation for social is refreshingly straightforward. It’s all about brand conversations.
(Your Brand Mentions / Total Market Mentions) x 100 = Your Social SOV
This metric can be applied to your brand name, a specific campaign hashtag, or even broader industry keywords. The trick is to be very precise about defining the "total market" by including every competitor you want to measure yourself against.
Defining Your Market Conversation
Where most brands stumble is in failing to properly define the scope of the conversation. Before you can crunch any numbers, you have to set clear tracking parameters.
What really counts as a "mention"? It’s more than just tags.
- Direct Mentions: This is the easy one—posts that use your brand's handle (like @TrackMyBiz).
- Hashtags: You'll want to track both your branded hashtags (e.g., #TrackMyBizLaunch) and relevant industry hashtags.
- Untagged Mentions: Don't forget the people talking about "TrackMyBiz" without using the @ symbol. This is a goldmine of candid feedback.
For instance, a sneaker brand launching a new shoe would track its campaign hashtag, its brand name, and the names of its three biggest rivals. Add up all the mentions for these terms, and you get your "Total Market Mentions." It’s that simple. Getting this right gives your team predictive power; if your brand has 100 social mentions out of a total of 1,000 in your defined market, you have a 10% SOV. That's a solid baseline you can work to improve. You can read more about using SOV as a strategic guide on 42Signals.com.
A Practical Scenario: Launching a New Product
Let's walk through an example. Imagine your company, "InnovateTech," is launching a new smart thermostat called the "EcoHub." You need to measure its SOV during launch week against your two main competitors, "ConnectHome" and "SmartLiving."
After a week of tracking, the data looks like this:
- InnovateTech's EcoHub Mentions: 3,500
- ConnectHome Mentions: 2,500
- SmartLiving Mentions: 2,000
The total market conversation adds up to 8,000 mentions (3,500 + 2,500 + 2,000).
Plugging this into our formula: (3,500 / 8,000) x 100 = 43.75%. This is a powerful metric. It tells you that you're absolutely dominating the conversation around the launch.
But a high volume of mentions doesn't tell the whole story. A 40% share of voice is far less valuable if most of the mentions are negative customer complaints. This is where sentiment analysis becomes non-negotiable.
Layering sentiment data on top of your SOV gives you the context you've been missing. It helps you see if your brand’s voice is coming across as positive, negative, or just neutral. A rising SOV with positive sentiment is the hallmark of a killer campaign. On the other hand, a huge SOV spike driven by negative mentions is a red flag that your PR or customer support team needs to jump on immediately.
The New Frontier: Calculating SOV in AI and LLM Recommendations

As customers increasingly ask conversational AI like ChatGPT, Gemini, and Claude for advice, a massive new frontier for Share of Voice has opened up. This isn't some future trend—it's happening right now. For brands still focused only on traditional search and social, it's a huge blind spot.
Think about it. When a potential buyer asks an AI, "What's the best software for small businesses?", the brands mentioned in that answer are instantly validated. A recommendation from an AI carries a unique weight of authority, making visibility in these outputs incredibly valuable. If you have a poor or nonexistent presence here, you're invisible at a critical moment in the buyer’s journey.
How to Calculate SOV in AI Responses
Calculating your share of voice in Large Language Models (LLMs) feels a lot like social media monitoring—it all comes down to mentions. But instead of tracking public posts, you're monitoring the AI-generated answers to specific, high-intent prompts relevant to your market.
The core formula is the same one we've been using:
(Your Brand's Mentions in AI Responses / Total Market Mentions in AI Responses) x 100
To actually get these numbers, you need a systematic way to query AI models and log what they say. This means defining a set of crucial prompts and then tracking how often your brand and your competitors appear in the answers over time.
This emerging discipline, often called Generative Engine Optimization (GEO), is all about understanding and influencing these outcomes.
A Quick Example of AI Share of Voice
Let’s say you’re "ZenDesk" and you want to see how you stack up against "Freshdesk" and "Help Scout" for the prompt, "best customer support tools for startups."
To get a reliable sample, you’d run this prompt across multiple LLMs (like ChatGPT, Gemini, and Claude) 100 times. The results might come back like this:
- ZenDesk Mentions: 40
- Freshdesk Mentions: 35
- Help Scout Mentions: 15
- Other Mentions: 10
Here's a simple table to visualize the calculation.
LLM Share of Voice Calculation Example
| Brand | Mentions in 100 AI Responses | Share of Voice (%) |
|---|---|---|
| ZenDesk | 40 | 40% |
| Freshdesk | 35 | 35% |
| Help Scout | 15 | 15% |
| Other Brands | 10 | 10% |
| Total | 100 | 100% |
The total "market conversation" in this test adds up to 100 mentions. With 40 of those mentions, ZenDesk’s SOV is (40 / 100) x 100 = 40%. This straightforward calculation gives you a powerful snapshot of your brand's prominence in AI-driven recommendations.
This new flavor of SOV is a direct proxy for your brand's authority in the eyes of the AI. If an LLM consistently recommends your competitor over you, it's a dead giveaway that the underlying data it was trained on favors them.
This metric is far more telling than just counting raw mentions. For example, getting mentioned 25 times out of 100 total responses gives your brand a strong 25% SOV. But if your brand gets 100 mentions while your competitors rack up 400, your SOV plummets to a much weaker 20%. It’s all about context.
Keeping a close eye on this is non-negotiable now. Agencies and brands can use specialized tools for https://trackmybusiness.ai/llm-visibility-tracking-agencies to automate the querying and tracking process, ensuring they always have a pulse on their AI-driven brand presence.
Common Mistakes in SOV Reporting and How to Avoid Them
A precise share of voice calculation can give your marketing strategy a clear direction, but a flawed one will have you chasing ghosts. Even seasoned teams fall into common traps that skew their data, leading to wasted budget and missed opportunities. Getting this right is about making your reporting accurate and, just as importantly, defensible.
The first classic blunder is defining your competitors too narrowly. It’s easy to get tunnel vision, focusing only on the big names you talk about in weekly meetings. But this completely ignores the scrappy startups or niche players who are actually winning the conversation on specific channels. Who you're fighting against in organic search might be totally different from your main rival on social media.
Expanding Your Competitive Landscape
To sidestep this, you need to think of your competitive set as a living, breathing list—not a static document carved in stone. It has to be dynamic and channel-specific.
- For SEO: Fire up your keyword tools and see who actually ranks for the terms that matter most. Don't just assume. You might discover that industry blogs or affiliate sites are your real competition for those valuable top-of-funnel keywords.
- For Social: Keep an eye on industry hashtags and keyword discussions. This is where you'll spot the emerging voices and brands gaining traction in your space before they become household names.
- For AI Mentions: Make it a habit to ask LLMs the same questions your customers would. You'll see which brands are getting recommended, including new ones you've never heard of. This is exactly what platforms like TrackMyBiz were built to automate, saving you from a ton of manual work.
Another major pitfall is getting seduced by the numbers and ignoring the context. A huge volume of mentions means nothing if you don't understand the sentiment behind them. That sudden spike in your SOV? It could easily be driven by a viral customer service complaint, which is hardly a victory.
An accurate share of voice calculation is more than a numbers game. It’s about understanding the quality, context, and sentiment of your visibility—not just the raw quantity.
Finally, one of the most common mistakes is mashing mismatched metrics together from different channels and hoping for a meaningful score. You can't just add your organic search impressions to your social media mentions and call it a day. It's like comparing apples and oranges; the units of measurement have no common ground and the resulting number is pure fiction.
Creating a Blended Yet Meaningful Score
To build a blended SOV score that actually means something, you have to weight each channel based on its importance to your business goals.
For a B2B SaaS company, visibility in AI-generated recommendations might be far more valuable than mentions on TikTok. In contrast, a DTC fashion brand would likely place a much higher strategic value on conversations happening on social media.
This means assigning a strategic weight to each channel’s SOV percentage before you even think about creating a unified report. By normalizing and weighting your data this way, you can build a comprehensive and defensible report that truly reflects your brand’s position in the market. This is how you turn a potential vanity metric into a powerful strategic tool.
Common Questions About Calculating Share of Voice
Even with all the right formulas in hand, practical questions always pop up when you start putting a share of voice strategy into practice. Let’s tackle some of the most common ones we hear from brands digging into this for the first time.
How Often Should I Calculate Share of Voice?
The right cadence for your share of voice calculation really depends on how fast your market moves. If you're in a high-velocity space like e-commerce or SaaS, you'll want to check in monthly or even weekly. You have to be that vigilant to spot new trends or competitor moves before they build up a head of steam.
Here’s a good rule of thumb:
- Organic and Paid Search: A monthly check-in is a great baseline. This timing lines up nicely with content marketing cycles, campaign reporting, and the occasional algorithm update.
- Social Media and AI Mentions: These channels are a different beast entirely. They can shift overnight. For these, you need continuous or at least weekly monitoring, especially if you're in the middle of a product launch, a big marketing campaign, or, heaven forbid, a brand crisis.
For most businesses, a big-picture, comprehensive review across every channel each quarter provides a solid strategic overview. But you’ll want to supplement that with more frequent spot-checks on the volatile channels like social and AI recommendations.
What Is a Good Share of Voice to Aim For?
This is the million-dollar question, and the answer is: it depends. There's no magic number that works for everyone. It’s all relative to your specific market.
In a really fragmented industry with dozens of smaller players, grabbing even 15-20% SOV could make you the undisputed market leader. On the flip side, if you're in a market dominated by a couple of titans, fighting your way to a 25-30% SOV would be a monumental win, signaling a major power shift.
The real goal for many is achieving "excess share of voice" (eSOV), where your SOV is higher than your actual market share. For years, this has been a reliable leading indicator of future growth.
Your primary objective should be continuous improvement. Start by benchmarking your performance against your most direct competitors and set realistic, incremental growth targets quarter over quarter.
Can I Calculate SOV with Free Tools?
Yes, you absolutely can get a basic share of voice calculation done with free tools, but be prepared for a lot of manual work and some serious limitations. You can cobble together a decent-enough picture if you're scrappy.
For instance, setting up Google Alerts for your brand and competitor names is a simple way to track media mentions. You can also use the built-in search functions on social platforms to manually count brand conversations. For search, your own Google Search Console gives you invaluable impression data for your organic footprint.
But let's be honest—these methods are incredibly time-consuming and almost impossible to scale. They often lack the precision you need to make confident strategic decisions, especially when you get into more advanced calculations like weighted organic SOV or automated AI mention tracking. For consistent, accurate, and scalable SOV monitoring, specialized platforms quickly become a necessity. They provide the depth and historical context you need to truly guide your brand strategy.
Ready to stop guessing what AI assistants are saying about your brand? TrackMyBiz provides the automated monitoring you need to see your real-time Share of Voice in ChatGPT, Gemini, and more. Start a free scan today.