
Forget vanity metrics. If you’re only tracking things like ROAS, you're looking in the rearview mirror. Share of Voice (SOV) is the one KPI that actually predicts your future market share, making it arguably the most important growth metric you have.
Simply put, calculating share of voice is about measuring how visible your brand is compared to your competitors. It's the ultimate benchmark for understanding your true position in the market.
Why Share of Voice Is Your Most Important Growth Metric

While other metrics tell you about the efficiency of past campaigns, SOV is a powerful leading indicator. It’s a forecast. It quantifies your presence in the market’s conversation right now, which has a direct and proven link to how much market share you'll have tomorrow.
This isn't just a marketing theory; it's a well-documented business principle. Decades of research, including landmark studies from the IPA, have confirmed that Excess Share of Voice (eSOV)—the gap between your SOV and your current market share—is a reliable predictor of growth.
The data is clear: for every 10 percentage points of eSOV a brand maintains, it can expect to gain about 0.5% in market share each year. If you want to dive deeper into the numbers, you can read the full research on eSOV and growth and see for yourself.
The New Battleground for Visibility
The idea of SOV isn't new, but its importance has exploded in today's fragmented digital world. Your brand's voice now has to cut through the noise on countless channels, from traditional search and social media to the new AI-powered gatekeepers of information.
To succeed today, a clear understanding of where your brand stands across these channels is non-negotiable. This table breaks down the modern landscape where Share of Voice is won or lost.
Modern Share of Voice Channel Overview
| Channel Type | Key Platforms | Why It Matters |
|---|---|---|
| Traditional Search | Google, Bing | Still the foundation. Your visibility in organic search results for key terms directly impacts brand discovery and credibility. |
| Paid Media | Google Ads, Social Ads | Measures your advertising presence against competitors. A direct reflection of your media spend and targeting efficiency. |
| Social Media | TikTok, Instagram, LinkedIn | Tracks organic mentions, hashtag usage, and engagement. This is the pulse of real-time customer conversation and sentiment. |
| AI Assistants | ChatGPT, Gemini, Perplexity | The new frontier. Measures if your brand is recommended in AI-generated answers, which is the new "word-of-mouth." |
What worked yesterday is no longer enough. The battle for visibility has moved far beyond just who shouts the loudest with their advertising budget.
Share of Voice is no longer just about who shouts the loudest in advertising. It’s about who is most present, most trusted, and most recommended across every channel where customers are looking—especially AI assistants.
Think about the new ways customers find solutions:
- Traditional Search: Are you ranking on Google for your target keywords?
- Social Media: Is your brand dominating the conversation and hashtags on TikTok and Instagram?
- AI Assistants: Are you the top recommendation when someone asks ChatGPT or Gemini for "the best…"?
If you're not measuring your visibility across this entire landscape, you’re operating with a massive blind spot. Mastering SOV isn't just another marketing task anymore—it’s a core strategy for survival and sustainable growth.
The Share of Voice Formula Everyone Knows (and How Most People Get It Wrong)
At its heart, the math for calculating share of voice looks deceptively simple. It's just a percentage showing how much of the conversation your brand owns compared to everyone else.
The classic formula is:
(Your Brand Mentions / Total Market Mentions) x 100 = Your Share of Voice (%)
But here’s the thing: a formula is only as good as the numbers you feed it. The real work isn't the division; it's the strategic thinking you put into defining what "your mentions" and "total market mentions" actually mean for your business.
If you just plug in raw numbers without any context, you're going to get a skewed, unreliable picture of where you really stand.
First, Define Your Conversation Universe
Before you can measure anything, you have to decide exactly what you're measuring. This isn't just about tracking your brand name. A smart approach requires casting a wider net to capture a full basket of relevant terms.
Let's imagine you're a new SaaS company with a project management tool. Your "conversation universe" needs to include more than just your company name. You should be tracking:
- Brand Name: "ProjectFlow" (and don't forget common misspellings people might use).
- Product Names: Any specific tool names, like "FlowBoard" or "TaskPilot."
- Branded Hashtags: Things like #ProjectFlowApp or #GetInTheFlow.
- Key Executives: Mentions of your CEO or other public-facing leaders who speak for the brand.
This gives you a much more holistic and realistic view of your brand’s actual footprint online.
Next, Identify Your Real Market
This is where so many companies stumble. They define their "total market" in one of two flawed ways: either way too narrowly (tracking only their single biggest competitor) or far too broadly (tracking every single company in the space, including giants they don't actually compete with).
The point isn't to track every mention of every company that exists. The goal is to define a realistic competitive set that accurately reflects the market you are actively trying to win right now.
To get this right, you need to identify your true competitors. For our SaaS example, this means looking beyond the obvious market leaders like Asana or monday.com. You need to dig a little deeper to find:
- Direct Competitors: Companies offering a very similar product to the exact same audience.
- Indirect Competitors: Businesses solving the same problem but with a totally different solution (like a simple to-do list app, for instance).
- Aspirational Competitors: The brands you want to be competing with in the next few years.
Once you've built that list, you apply the exact same tracking logic you used for your own brand to each of them. You’ll track their brand names, product names, and unique hashtags.
The sum of all those competitor mentions—plus your own—is what becomes your "Total Market Mentions." This simple step ensures you're comparing apples to apples, creating a reliable and repeatable process for calculating a share of voice figure you can actually trust.
How to Calculate Share of Voice for Any Channel
Calculating your Share of Voice isn't a simple, plug-and-play formula. The reality I've seen with countless brands is that a mention on Google means something entirely different than a mention on TikTok. And both of those are worlds away from getting recommended by ChatGPT.
To get a real, 360-degree view of your brand’s presence, you need a different playbook for each channel.
The core idea is always the same: you're measuring your slice of the conversation. But the metrics you use have to change. What you track on a visual, fast-paced platform like Instagram (think hashtag usage) is fundamentally different from what matters in the world of organic search (like keyword visibility).
This flowchart breaks down the basic process. You're always comparing your brand's mentions against the total conversation happening in your market.
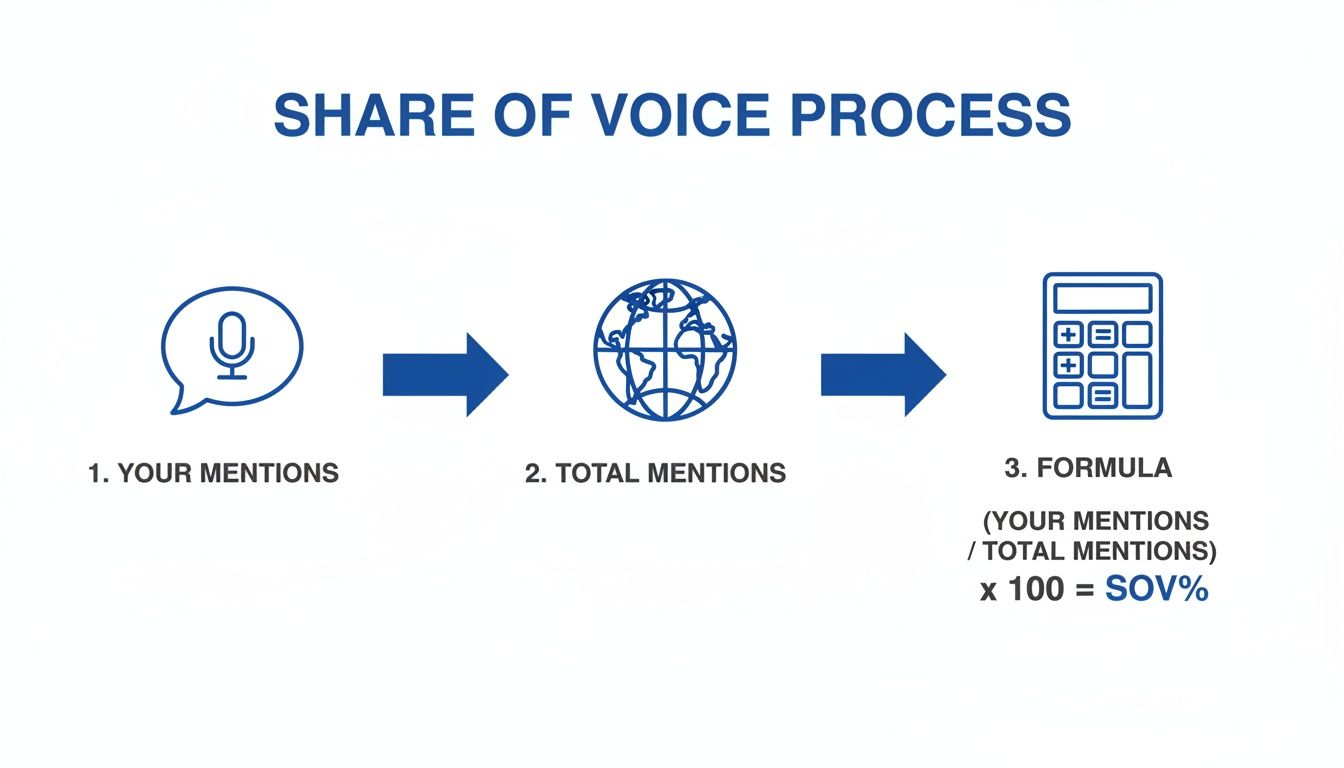
Ultimately, getting an accurate SOV calculation comes down to one thing: correctly defining and capturing your mentions versus the total market's mentions, no matter the channel.
Mastering SOV for SEO and Search Visibility
When it comes to organic search, Share of Voice is much more than just tracking your rank for a single keyword. True search visibility means owning your presence across the entire cluster of keywords your audience actually uses to find solutions.
Your main metric here is organic visibility, often called impression share. You're basically figuring out your click-through rate (CTR) potential across a whole list of target keywords.
Here’s how I've seen it done effectively:
- Look at Impression Share: Instead of just rankings, track the total number of impressions your site gets for a bucket of keywords compared to the total search volume available.
- Weight Your Rankings: Not all rankings are created equal. A #1 spot is exponentially more valuable than ranking #9, so your model should reflect that.
- Measure Keyword Ownership: For a defined set of keywords, what percentage do you own on page one versus your direct competitors?
To really nail this, it’s critical to learn how to analyze Share of Voice across platforms, because what works for SEO won't work for social.
Decoding Share of Voice on Social Media
On social media, the conversation is much more direct. SOV here is a straight-up reflection of brand chatter. You’re not just counting your own posts; you’re tracking how often everyone else is talking about you.
I always tell teams to focus on these key metrics:
- Brand Mentions: The raw count of how many times your handle is tagged or your brand name is mentioned (@YourBrand).
- Hashtag Usage: The volume of posts using your branded hashtags (#YourBigCampaign) compared to your competitors' hashtags.
- Engagement Share: This is a bit more advanced. It looks at your share of the total likes, comments, and shares happening within your competitive space.
A high number of mentions is great, but sentiment is the real story. A huge spike in negative mentions can inflate your SOV while actively hurting your brand. Always, always layer sentiment analysis on top of your volume tracking.
The New Frontier: Measuring SOV in AI and Voice Search
The rise of AI assistants like ChatGPT has created a brand new battleground for brand discovery. When someone asks an AI for a recommendation, the answer it gives is the new word-of-mouth. Plain and simple.
This is where a new metric, recommendation share, comes into play. It’s a specialized type of SOV that measures how often an AI assistant recommends your brand for relevant prompts compared to your competitors. For anyone in ecommerce, this is already mission-critical. I break this down further in our guide to ChatGPT brand monitoring for ecommerce.
This isn't some future trend; it's happening now. The global voice commerce market hit a staggering $34.21 billion in 2023 and is on track to reach $286.87 billion by 2033. This growth is being driven by the smart speakers in millions of homes.
Tracking recommendation share isn’t something you can do with old tools. It requires new platforms that can monitor LLM outputs at scale, giving you a clear picture of your brand's standing on this incredibly important new channel.
Channel-Specific SOV Metrics and Tools
To tie this all together, it's helpful to see how these different approaches stack up side-by-side. Each channel has its own unique language and set of tools for measuring your brand's presence.
| Channel | Primary Metric | Example Tools | Measurement Nuance |
|---|---|---|---|
| Traditional SEO | Impression Share / Organic Visibility | Ahrefs, Semrush, Moz | Measures presence across a strategic keyword set, weighted by search volume and ranking position. It's about potential traffic. |
| Social Media | Brand Mentions & Engagement Share | Brand24, Sprout Social | Tracks direct conversations and hashtag usage. The key is to layer sentiment analysis over raw mention volume. |
| AI Chatbots | Recommendation Share | TrackMyBusiness.ai, Manual Audits | Measures how often AI recommends your brand for relevant queries. This is a new frontier requiring specialized monitoring tools. |
The big takeaway here is that a holistic SOV strategy requires a multi-tool, multi-metric approach. Relying on a single number from a single channel will leave you with a massive blind spot as your customers spread their attention across search, social, and now, AI.
Building a Clean and Reliable Data Set
Any calculation is only as good as the data you feed it. When it comes to share of voice, a messy or flawed data set will inevitably lead to flawed insights. You’ll end up misreading your market position and making strategic decisions based on bad information. It’s the classic case of garbage in, garbage out.
The goal isn't just to scoop up mountains of data, but to collect the right data. That whole process starts with filtering out the irrelevant noise that can easily inflate your mention counts and throw your entire analysis off track.
Filtering Out the Noise
Most modern monitoring tools let you use Boolean queries to fine-tune what you collect. Think of this as your first line of defense against junk mentions. For instance, if your brand is named "Comet" (like the cleaning product), you'll obviously want to cut out all the chatter about astronomy.
A simple Boolean query to handle this might look like:
("Comet" OR "Comet Cleaner") AND NOT ("meteor" OR "asteroid" OR "space" OR "NASA")
This one simple step makes sure the mentions you're counting are actually about your brand. It gives you a much cleaner foundation to work from. Without it, your numbers will be wrong from the very beginning.
The Power of Smart Sampling
Look, you don't need to analyze every single mention across the entire internet to get an accurate picture. Frankly, trying to do so is a recipe for overwhelm and inefficiency. The real key is smart sampling—analyzing a representative slice of the conversation to draw solid conclusions about the whole thing.
It’s just like a political poll. Pollsters don’t call every single voter in the country; they survey a carefully chosen group that reflects the broader population. We’re applying that same principle here.
A well-constructed sample of 1,000 relevant mentions can tell you more than a messy data set of 100,000 irrelevant ones. Quality and relevance should always win out over raw volume.
To build a good sample, make sure you’re pulling mentions from a diverse set of sources—forums, social media, news sites, you name it. You also need to cover a long enough time period to avoid getting skewed by a random, short-term anomaly. For SaaS companies, knowing how to apply these techniques is a huge part of effective AI brand tracking for SaaS companies.
Why Normalization Is Non-Negotiable
So what happens when a competitor has a viral moment or a PR disaster? Their mention volume is going to go through the roof, but that doesn't mean their strategic position has actually improved for the long haul. This is where normalization becomes absolutely essential.
Normalization is just the process of adjusting your data to account for those wild spikes and outliers. It lets you make a fair, apples-to-apples comparison by revealing the real trend, not just the temporary noise.
A common way to do this is to use a rolling average of mention volume over the past 90 days instead of just looking at last week’s numbers. This smooths out any sudden, weird spikes and gives you a much more stable and reliable baseline for your share of voice calculation. It stops you from overreacting to a competitor's fleeting moment in the sun and helps you stay focused on the sustained trends that actually matter.
Common SOV Calculation Mistakes and How to Avoid Them

Calculating share of voice looks simple on the surface, but a few classic mistakes can turn a potentially insightful analysis into a report that's not just useless, but actively misleading. I’ve seen these pitfalls trip up countless teams. The good news is they’re easy to sidestep once you know what to look for.
The goal here isn't just to get a number; it's to get a credible, actionable picture of your actual standing in the market.
One of the biggest errors I see is treating every single mention as equal. A raw count of brand mentions means absolutely nothing without context. Imagine your brand scores 1,000 mentions in one day. Looks great, right? But what if 80% of them are from furious customers complaining on social media? That’s not a win; it’s a five-alarm fire.
Ignoring sentiment is a critical failure. A massive spike in negative chatter can inflate your SOV number while your brand reputation is actively tanking. You have to layer sentiment analysis over your volume data. This one step separates genuine brand growth from a PR disaster, giving you a much truer sense of your voice in the market.
Misidentifying Your Competitive Set
Another common trap is getting your list of competitors wrong. This usually happens in one of two ways: you’re either too narrow or way too broad.
Focusing only on your single biggest rival feels good for the ego, but it ignores the hungrier, nimbler startups chipping away at your market share. You end up with an inflated sense of your own importance while completely missing emerging threats until it's too late.
On the flip side, tracking every single company in your industry—including giants you don't realistically compete with—just dilutes your data into meaninglessness. A local coffee shop shouldn't be measuring its SOV against Starbucks. The comparison is pointless.
Your competitive set should be a curated list of direct, indirect, and aspirational rivals that you are actively trying to beat today. This focus makes your SOV calculation relevant and actionable.
Overlooking Reach and Influence
Finally, so many brands forget to weight their mentions. This one is huge. Not all sources are created equal. A feature in a major news publication has a profoundly greater impact than a random post from an account with ten followers. Counting both as "one mention" is a significant oversight.
To fix this, you need to assign a weight to mentions based on the source's reach or influence. A few practical ways to approach this:
- Follower Counts: Use follower numbers on social media as a basic, accessible proxy for reach.
- Domain Authority: For media mentions, a site's Domain Authority (DA) works well as a quality score.
- Estimated Views: Factor in estimated viewership or readership for articles, videos, and other media.
This weighted approach gives you a far more accurate model of your actual influence in the market. It shifts your analysis from a simple popularity contest to a strategic measurement of your brand's true impact. By sidestepping these common mistakes, you ensure the time you spend calculating share of voice yields insights you can genuinely trust and act on.
Turning Your SOV Data into Actionable Insights
Alright, you've done the hard work and calculated your share of voice. But let's be honest, a raw percentage on a spreadsheet doesn't actually do anything. The real magic happens when you turn those numbers into strategic moves that grow your business.
A single SOV number is just a report card. What you're really looking for are the trends, the shifts, and the patterns that reveal the opportunities and threats hiding in plain sight.
The goal is to transform that data from a static report into a living, breathing dashboard. This becomes your mission control, giving you a clear, at-a-glance view of the competitive landscape. This is where numbers become business intelligence.
Building Your SOV Dashboard
Your dashboard doesn't need to be some overly complicated beast. In my experience, the best ones focus on a few key metrics that tell a clear story. I always tell my clients to start with these three core visualizations:
- SOV Trend Line vs. Competitors: This is your North Star. Plot your brand's SOV against your top two or three competitors on a line graph over time (weekly or monthly works well). This instantly shows you who's gaining ground and who's falling behind.
- SOV by Channel: A simple bar chart breaking down your SOV across search, social, and AI recommendations is incredibly revealing. It pinpoints exactly where you're dominating and, more importantly, where your competitors have an edge you need to challenge.
- AI Recommendation Share: For any modern brand, this is non-negotiable. You have to track how often your business is recommended by assistants like ChatGPT for your most important prompts. If you're losing here, you're slowly becoming invisible to a huge segment of buyers.
Once you have the numbers, the next critical step is making sense of them. For a deeper dive, check out this excellent guide on turning data into actionable insights, which provides a solid framework for moving from analysis to action.
Setting Up Proactive Alerts
A dashboard is great for spotting trends, but you also need an early warning system for sudden, significant market shifts. If you're relying on manually checking a dashboard once a week, you'll always be a step behind.
You don't want to find out a competitor launched a massive campaign a week after it started. Automated alerts turn your SOV monitoring from a reactive report into a proactive intelligence system.
Set up alerts for specific triggers that demand immediate attention. For instance, you should get a notification if:
- A competitor’s SOV on a key channel jumps by more than 15% in a single week.
- Your brand’s name drops out of the top three AI recommendations for a mission-critical prompt.
- A new, previously untracked competitor suddenly pops up with over 5% SOV.
Think of these alerts as your tripwires. They allow your team to respond to threats and opportunities in near real-time, helping you protect your market share before it’s too late. To make this happen, you might want to look into dedicated competitor AI analysis tools that can automate this kind of monitoring.
Got Questions About Share of Voice? You’re Not Alone.
Even with a clear plan, a few questions always pop up when you first start digging into Share of Voice. Getting these common points straightened out from the beginning will make sure your analysis is sharp and useful right away.
How Often Should I Actually Calculate This Stuff?
For most companies, running the numbers quarterly is the sweet spot. This cadence is perfect for spotting real trends and seeing how your strategy is playing out over time, without getting lost in the noise of daily or weekly blips.
But that’s not a hard-and-fast rule. Context is everything. If you're in the middle of a huge product launch, a major rebrand, or just operating in a chaotic, fast-moving market, you'll want to tighten that timeframe. Shifting to monthly or even weekly tracking in those moments gives you a near real-time view of your campaign’s impact and how competitors are reacting.
What’s the Real Difference Between Share of Voice and Share of Market?
This is a big one, and it’s a point of frequent confusion. They sound similar, but they measure two completely different—though related—parts of the business.
- Share of Market (SOM) is all about sales. It’s your slice of the total revenue pie in your industry. Think of it as a lagging indicator; it tells you how you’ve already performed.
- Share of Voice (SOV) is about the conversation. It’s your brand's percentage of all the chatter and advertising in your space. This is a leading indicator, giving you clues about your future growth.
The key insight here is that when your Share of Voice is higher than your Share of Market (often called eSOV, or Excess Share of Voice), it’s a strong predictor that your market share is about to grow.
Can a Small Business Really Measure SOV Effectively?
Absolutely. In fact, SOV can be a secret weapon for smaller businesses. You’re probably not going to out-shout a global brand across every channel, and you don’t have to. The trick is to get hyper-focused.
A small business can totally dominate SOV within a specific, well-defined niche. Forget the whole market; aim to own the conversation on a key local forum, for a very specific set of long-tail keywords, or within a single, highly-targeted social media hashtag. This approach turns share of voice from an intimidating corporate metric into something actionable and scalable for a business of any size.
Ready to see how your brand stacks up in the new world of AI search? TrackMyBiz gives you a free, instant scan to show you exactly what assistants like ChatGPT and Gemini are saying about you right now. Uncover your recommendation share and start protecting your brand's AI narrative. Start your free scan today.