
To get a real handle on your Share of Voice, you need to measure your brand's visibility against the entire market conversation. Think of it as your slice of the pie.
The basic formula is simple: (Your Brand's Metrics / Total Market Metrics) x 100. This core idea holds true whether you're looking at search engine results, social media chatter, or paid ad spend.
Understanding Share of Voice in Today's Market

Share of Voice (SOV) has come a long way from its old-school advertising roots. Today, it’s a crucial health check for your brand’s visibility across every digital place your customers form opinions. It answers one simple question: When people talk about your industry, how often are they talking about you?
Originally, the concept was much more straightforward. It started as a simple ratio of an advertiser's media budget compared to the total ad spend in their category. For example, if a company spent $5 million on ads while the total market ad spend was $100 million, its SOV was 5%.
As the internet took over, this definition had to evolve. It expanded to include online mentions and digital conversations, reflecting actual visibility rather than just how much you were spending. You can read more about the evolution of Share of Voice on Wikipedia to see how far it's come.
Why Modern SOV Is More Than a Vanity Metric
It’s a huge mistake to see SOV as just a way to keep score against your competitors. It's actually a leading indicator of your future market share.
When your SOV consistently outpaces your current market share, it often signals that growth is on the horizon. This metric is packed with strategic insights that help you:
- Benchmark against competitors: Get a clear picture of where you stand in the market conversation, not just in sales figures.
- Identify channel weaknesses: Find out if you’re crushing it in search but are a ghost on social media, or the other way around.
- Spot emerging threats: Notice new players who are gaining traction in online discussions before they start eating into your revenue.
A high Share of Voice means your brand is top-of-mind. It’s the difference between being part of the conversation and being an afterthought. If you’re not measuring it, you’re flying blind in a very crowded market.
The Shift to a Holistic View
To calculate Share of Voice effectively today, you have to look beyond a single channel. A modern approach pieces together data from all over the web to build a complete picture of your brand’s presence. This includes everything from your Google rankings for critical keywords to the volume of chatter about your brand on TikTok.
Before we dive into the specific "how-to" for each channel, it helps to have a high-level view of the formulas you'll be working with. Each one is a slight variation of the same core principle.
Core Share of Voice Formulas by Channel
Here's a quick reference table that breaks down the basic formulas you'll be using to calculate SOV.
| Channel | Metric to Track | Basic Formula |
|---|---|---|
| Organic Search | Keyword Rankings, CTR, Impressions | (Your Brand Impressions / Total Market Impressions) x 100 |
| Paid Search | Impression Share, Clicks | (Your Impressions / Total Available Impressions) x 100 |
| Social Media | Brand Mentions, Hashtags, Reach | (Your Brand Mentions / Total Industry Mentions) x 100 |
| AI/LLM Results | Brand Mentions in Responses | (Your Mentions / Total Competitor Mentions) x 100 |
As you can see, the metric changes, but the logic stays the same: your piece of the total pie.
This guide will walk you through calculating SOV across these key areas, turning raw data into a powerful tool for making smarter business decisions. You'll learn not just the formulas, but the context you need to make the numbers truly meaningful.
Laying the Groundwork: How to Gather the Right Data for SOV
Let's be blunt: any attempt to calculate your share of voice is completely useless without the right data. Before you even think about plugging numbers into a formula, you have to get your data-gathering process locked down. This isn't just about pulling random metrics; it’s about consistently collecting the right ones.
Your first move is to define the battlefield. Who are you really up against? It’s tempting to just list your direct rivals, but that's a rookie mistake. You need to include the aspirational brands grabbing the attention you want and the scrappy disruptors who are winning conversations, even if their product isn't a perfect match for yours. A narrow competitor list will only give you a dangerously inflated and inaccurate SOV.
Pinpointing the Right Metrics for Each Channel
Once you have a clear picture of the competitive landscape, it's time to source the specific data points for each channel. The whole point is to find metrics that genuinely represent visibility and the volume of conversation happening.
Here’s a practical breakdown of what you need to start collecting:
- Organic Search: Don't get fixated on just rankings. What you really need are keyword visibility scores (most good SEO tools call this SOV anyway), the estimated organic traffic for your core set of keywords, and total impressions right from your Google Search Console.
- Paid Media: This one is more straightforward. The metric you care about most is Impression Share, which platforms like Google Ads give you directly. It tells you exactly what percentage of all possible impressions your ads actually managed to capture.
- Social Media: Forget follower counts—they're a vanity metric. The data that matters here are brand mentions (both tagged and untagged), the usage of relevant hashtags, and the overall volume of conversation happening around your specific market.
The most common pitfall I see is people mixing apples and oranges—they’ll try to compare their organic search traffic to a competitor's paid ad impressions. That's a recipe for meaningless data. Each channel needs its own dataset and its own separate SOV calculation.
Choosing the Right Tools for the Job
Trying to gather all this information by hand is a surefire way to drive yourself crazy. You absolutely need a reliable toolkit to automate the collection process and keep the data consistent. I’ve found that using a mix of specialized platforms is almost always the most effective route.
For instance, a solid tech stack might look something like this:
- SEMrush or Ahrefs for all things organic and paid search. These tools are the gold standard for tracking keyword visibility and getting solid estimates of competitor traffic.
- Brandwatch or Sprout Social for social listening. They're brilliant at capturing the sheer volume of conversations and mentions happening across all the major social networks.
- TrackMyBiz for the newest and arguably most important frontier—AI search. As chatbots and AI assistants become a go-to source for information, knowing your visibility in AI-generated answers is no longer optional. For example, SaaS companies can use AI brand tracking to see exactly how often their solution gets recommended in LLM responses compared to their rivals.
With your competitors defined, your metrics identified, and your tools in place, you’ve officially built the data foundation you need. This prep work ensures that when you finally get to calculating your share of voice, the number you get is a true reflection of your market presence—one you can actually use to make smart strategic decisions.
Calculating Share of Voice for SEO and Organic Search
Organic search is where brands are truly built. Unlike paid ads, a top spot here isn't bought—it's earned through authority and relevance. That's what makes it such a powerful channel to own. But to really figure out your Share of Voice in search, you have to look beyond just tracking a handful of your favorite keywords.
The real goal is to understand your visibility across the entire conversation your customers are having. This means mapping out a complete keyword universe, including not just the high-intent commercial terms, but all the informational questions, long-tail phrases, and comparison queries that make up your market. A narrow keyword list will only give you a dangerously inflated and inaccurate SOV.
From Rankings to Real Visibility
A number one ranking feels great, but its actual value is tied directly to how many people search for that term each month. This is why a simple rank-tracking report isn't enough; you need a weighted approach. Landing the top spot for a keyword with 10,000 monthly searches is worlds more valuable than ranking #1 for a term with only 100 searches.
To get an accurate picture, you need to pull together three crucial data points:
- Your keyword rankings across your entire defined set.
- The monthly search volume for every single one of those keywords.
- The estimated click-through rate (CTR) for each ranking position.
The formula is pretty straightforward: (Your Impressions / Total Market Impressions) x 100. You calculate "your impressions" by multiplying a keyword's search volume by the CTR for your ranking position.
This simple visualization breaks down how you turn raw data into a strategic SOV metric.
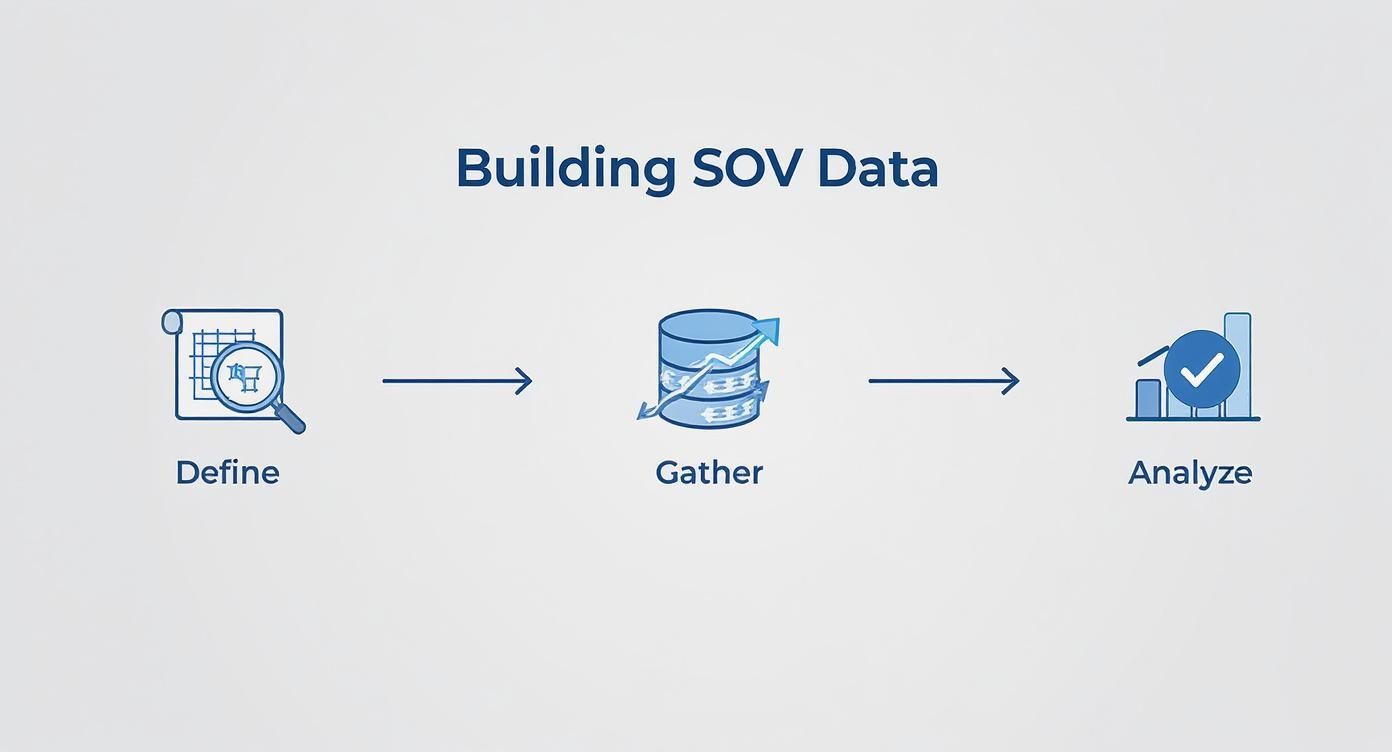
The workflow makes it clear: a disciplined approach of defining your market, gathering the right data, and analyzing it correctly is the only way to arrive at a meaningful SEO Share of Voice score.
A Practical B2B SaaS Example
Let's say you're a B2B SaaS company selling "project management software for remote teams." Just tracking that one phrase would be a huge mistake. The real market conversation includes keywords like "best Asana alternative," "how to manage distributed teams," and "collaboration tools for hybrid work."
You'd start by compiling a list of maybe 100 such keywords that represent the total market conversation. Let's imagine the total search volume for this entire basket of terms comes out to 500,000 searches per month.
Next, you fire up your SEO tool and find that your website's rankings across all these keywords earn you an estimated visibility of 75,000 impressions. You also see that your main competitor is pulling in 150,000 impressions, and a smaller niche player has 50,000. The rest of the impressions are scattered among other sites.
To calculate your organic SOV, the math looks like this:
(75,000 Your Impressions / 500,000 Total Market Impressions) x 100 = 15% SOV
That simple percentage tells you everything. You currently own 15% of the organic search conversation, while your biggest rival commands a massive 30%. Suddenly, you have a clear benchmark and a quantifiable goal to chase. This data-driven approach turns SEO from a guessing game into a strategic growth driver.
To get a better handle on who these market players are, exploring different competitor AI analysis tools can give you the deeper insights needed to refine your keyword set and keep a close watch on your rivals.
How to Measure Your Voice on Social Media and Paid Ads

While SEO is a long game, social media and paid advertising are where you fight for attention right now. In these channels, you’re not just trying to get a click; you’re battling for a slice of your audience’s immediate focus and conversation. Measuring your presence here means shifting away from search-based metrics and diving into engagement and impression data.
The core idea of Share of Voice is still the same. It's a fundamental marketing metric showing your brand’s visibility relative to competitors. You calculate it by taking your brand’s specific metric (like social mentions), dividing it by the total market’s metric, and multiplying by 100 to get a percentage. If you need a refresher, Sprout Social has a great breakdown of the foundational concept.
We'll apply this same principle to both social and paid channels, just using different data.
Decoding Your Social Media Share of Voice
Forget follower counts. On platforms like Instagram, X (formerly Twitter), or TikTok, a massive but quiet audience is just a vanity metric. True social SOV lives in the volume and quality of conversations happening around your brand, your competitors, and your industry.
To get a real number, you’ll need a social listening tool. It’s the only way to track the conversation metrics that actually matter.
- Brand Mentions: This has to include both tagged mentions (@YourBrand) and, crucially, untagged mentions ("your brand").
- Relevant Hashtags: You need to track your branded hashtags against competitor and general industry hashtags.
- Conversation Volume: This is the total number of posts, comments, and shares related to a specific topic or keyword set.
Let's say you're a direct-to-consumer coffee brand. You’d set up your tool to track mentions of your brand name, but also competitors like "Blue Bottle" and "Intelligentsia." At the same time, you’d monitor broader hashtags like #specialtycoffee or #thirdwavecoffee to understand the total size of the conversation.
If your listening tool pulls in 1,000 relevant conversations this month and your brand was part of 250 of them, your social SOV is a solid 25%.
Finding Your Share of Voice in Paid Advertising
When it comes to paid ads on platforms like Google or Meta, things get a lot more direct. These platforms want your money, so they give you a clear metric to see how visible you are: Impression Share.
Impression Share is the percentage of impressions your ads received compared to the total number of impressions your ads were eligible to get. It’s basically a built-in SOV metric telling you how much of the available ad space you’re actually capturing.
So, if your Impression Share is 40%, it means your ads are showing up for 4 out of every 10 searches you were eligible for. The other 60% is going to your competitors or is being lost because your budget is too low.
Here’s where you can find this game-changing metric:
- In Google Ads: This is easy. Just add the "Impression share" columns to your campaign reporting view.
- In Meta Ads: It's a bit less direct here, as Meta doesn't have a one-to-one "Impression Share" metric. You can, however, get a good estimate by comparing your "Audience Size" and "Reach" metrics to see what percentage of your potential audience you're actually hitting.
By keeping a close eye on your Impression Share, you can make much smarter calls on where your ad budget goes. A low score might be a signal to increase your bids or budget. A high score means you're doing a great job dominating the paid ad space for your target keywords and audiences.
The Next Frontier: Measuring SOV in AI Search
As people shift from typing into a search bar to having conversations with AI assistants, a whole new battlefield for brand visibility has opened up. Chatbots like ChatGPT, Gemini, and Claude are now the starting point for millions of consumer questions. If your brand isn't part of their answers, you’re basically invisible.
This changes the game completely.
The old rules of SEO just don't cut it here. AI-generated answers are often presented as a single, confident response, making the familiar "ten blue links" on a Google page feel like a relic. This creates a massive headache for marketers trying to calculate share of voice in what feels like a total black box. You can't just track rankings anymore; you have to track mentions within the AI's actual answers.
Introducing Share of Answer
To get a handle on this, we need a new metric: Share of Answer. It’s a simple concept that measures how often your brand gets mentioned in AI-generated responses to relevant queries compared to your competitors. It's the most direct way to see how you're doing on this incredibly influential new channel.
Imagine a hotel chain trying to figure out its visibility. It needs to know how often its properties are recommended for prompts like:
- "What are the best all-inclusive resorts in the Caribbean for families?"
- "Suggest a luxury hotel in Miami with a rooftop pool."
- "Plan a romantic getaway to Cancun."
If the AI suggests your hotel in 20 out of 100 relevant test queries, and your competitors pop up a combined 80 times, your Share of Answer is 20%. Just like that, you have a clear benchmark to track your performance in AI search.
Monitoring Your Brand in LLM Responses
Trying to check these responses by hand is a fool's errand. It’s simply impossible to do at any meaningful scale. This is where specialized monitoring platforms become absolutely essential. They automate the entire process, pinging different AI models with hundreds of prompts every single day to see which brands get the nod.
This screenshot from TrackMyBiz shows exactly what that looks like—a dashboard tracking brand visibility inside AI responses over time.
The dashboard makes it easy to see how your brand's mentions are trending, which competitors are stealing the spotlight, and the overall sentiment of the AI's recommendations. This kind of data pulls you out of the world of guesswork and gives you a concrete way to measure and improve your presence.
Tracking your SOV in AI search isn't a "nice-to-have" anymore. It’s a critical part of any modern brand strategy. The insights you gain are vital, especially for marketing agencies that want to offer clients a real edge, a topic we dive into in our guide on LLM visibility tracking for agencies.
As more and more consumers turn to AI for answers, your Share of Answer will have a direct impact on your brand's relevance and growth.
Common SOV Calculation Mistakes to Avoid
Calculating Share of Voice is a fantastic way to benchmark your market position, but it's surprisingly easy to mess up. A few common blunders can twist your insightful analysis into a set of misleading numbers, sending your entire strategy off course. Let's make sure you avoid these traps so your data is both accurate and genuinely useful.
One of the most common errors I see is defining the competitive set way too narrowly. It’s totally natural to focus on your direct, head-to-head rivals, but doing that means you’re missing the forest for the trees.
Your real competition includes any brand fighting for the same slice of your audience's attention, even if their product is different.
Ignoring the Bigger Picture
Think about it this way: a company selling high-end electric bikes isn't just competing with other e-bike brands. They’re also battling for mindshare with companies selling commuter scooters, public transit passes, and even traditional cycling brands. All of these players are part of the broader "urban mobility" conversation.
If you limit your analysis to just e-bike competitors, you'll end up with a dangerously inflated and inaccurate SOV number. It feels good, but it's not real.
Another major pitfall is mistaking vanity metrics for actual voice. This happens all the time on social media.
Obsessing over follower counts is a classic mistake. A competitor might have 500,000 followers, but if their engagement is dead and no one is actually talking about them, their true Share of Voice is minimal. Your 50,000 highly engaged followers who actively mention your brand give you a much stronger voice.
True social SOV lives in the volume of active conversations—actual mentions, relevant hashtag usage, and user-generated content—not in passive audience numbers.
Confusing Mentions with Positive Buzz
Finally, a massive oversight is failing to analyze sentiment. A mention is not automatically a win. Not even close.
If a competitor's SOV suddenly spikes, you have to dig in and find out why. Was it because of a wildly successful product launch, or was it a tsunami of negative reviews and customer service horror stories? One is a victory, the other is a crisis.
Here’s a quick checklist to help you stay on the right track:
- Define Competitors Broadly: Look past direct product rivals to include anyone solving the same customer problem.
- Focus on Conversation Metrics: Prioritize active mentions and real engagement over passive metrics like follower counts or impressions that lack context.
- Always Analyze Sentiment: Use tools that can tell the difference between positive, neutral, and negative mentions to get the real story behind the numbers.
Steering clear of these mistakes is non-negotiable. It’s what ensures that when you calculate share of voice, the number you get is a genuine reflection of your brand's influence and true standing in the market.
Of course, here is the rewritten section, crafted to sound like an experienced human expert and match the provided examples.
Share of Voice: Your Questions Answered
Even with a clear game plan, a few questions always pop up once you start digging into the numbers. Let's tackle the most common ones we hear from marketers who are just getting their hands dirty with this metric.
How Often Should I Actually Calculate This Stuff?
For most businesses, running the numbers on a monthly basis is the sweet spot. It's frequent enough to spot trends and see if your strategies are making a dent, but not so often that you get lost in the day-to-day noise.
Now, if you're in a super competitive space or smack in the middle of a big product launch, you'll want to tighten that up. Shifting to weekly or bi-weekly check-ins can give you the near-real-time feedback you need to make smart pivots on the fly. Whatever you choose, just be consistent.
The point isn’t just to measure; it’s to react. More frequent tracking during key campaigns lets you adjust your ad spend and messaging when it matters most, making sure every dollar is working as hard as it can.
What's a "Good" Share of Voice to Aim For?
Honestly, there’s no magic number. It all depends on your industry. In a crowded market with a dozen serious players, grabbing even a 10% SOV could make you the dominant voice. In an industry with only two or three main competitors, you might be shooting for 40% or more to lead the pack.
A much better goal is to aim for "excess share of voice" (ESOV). This is a classic marketing principle that says your share of voice should be higher than your market share. For instance, if you have a 12% market share but you’ve managed to capture a 15% SOV, that 3% gap is your ESOV. Time and time again, this has been proven to be a leading indicator of future growth. Start by seeing how you stack up against your direct rivals and aim for steady gains.
Can I Just Mash It All into One Big Score?
You could, but you probably shouldn't. While it's technically possible to create a single weighted score across all your channels, you lose a ton of valuable insight. A positive shout-out on social media just doesn't carry the same weight as ranking #1 for a high-intent keyword in search.
It's far more effective to keep them separate: Search SOV, Social SOV, Paid SOV, and so on. This lets you see exactly where you're winning and where you're falling behind. The best approach is to use a dashboard that lets you see all these individual metrics in one place. That way, you get a complete picture of your brand's presence without losing the crucial details you need to make smart decisions about where to put your time and money.
Ready to measure your Share of Voice in the new era of AI search? TrackMyBiz gives you the data you need to see exactly what chatbots are saying about your brand. Start a free scan today and turn AI from a risk into a revenue channel.